Business Phone
051 8439995, 042 35911332
051 8439995, 042 35911332
Mon-Sat: 10.00-18.00

Understanding the complexities of obtaining a U.S. visa requires a deep awareness of the latest patterns and figures. At Immigration Experts, our commitment is to deliver precise and current information to assist you in making informed choices. Here are some insights into the latest approval rates for key visa categories such as O-1, EB-2 NIW, and E-2 visas.
This article provides up-to-date data and explains the methods used in their analysis, based on information from the highly respected U.S. Department of State and United States Citizenship and Immigration Services (USCIS). Join us as we examine these interesting developments, helping you navigate your visa application process more effectively.
To determine approval rates, we use a simple calculation: the number of approvals divided by the total of approvals plus denials. For the E-2 Visa, our analysis utilized the most recent ‘Nonimmigrant Worldwide Issuance and Refusal Data’ from the State Department, covering the years 2020 to 2022. Using this approach, we calculated the approval rates for this specific visa category.
For the EB-2 NIW, we carefully collected data from the latest United States Citizenship and Immigration Services (USCIS) report. By combining all the data on NIW approvals and denials, we applied the same formula to reveal the approval rates for this category.
In analyzing O-1A Visa approvals, we took a detailed approach, initially focusing on data from the USCIS. Our analysis was guided by the ‘STEM-Related Petition Trends’ report from October 2023. We specifically focused on STEM professionals, which represent the largest client base at Visa Franchise, to provide an in-depth look at O-1A Visa approval rates for this group.
Let’s delve into the approval rates for the EB2 NIW visa across different professions. In 2021, the approval rate was an impressive 86%, with 9,650 cases approved. The following year saw a significant increase, as the approval rate rose to 90%, with 19,090 cases approved in 2022.

However, in 2023, the trend took a downward turn, with the approval rate dropping to 80%, although 31,750 cases still received approval. These shifts in approval rates highlight the changing dynamics of visa approvals in the EB-2 NIW category and call for an in-depth analysis of the factors that influence these changes.
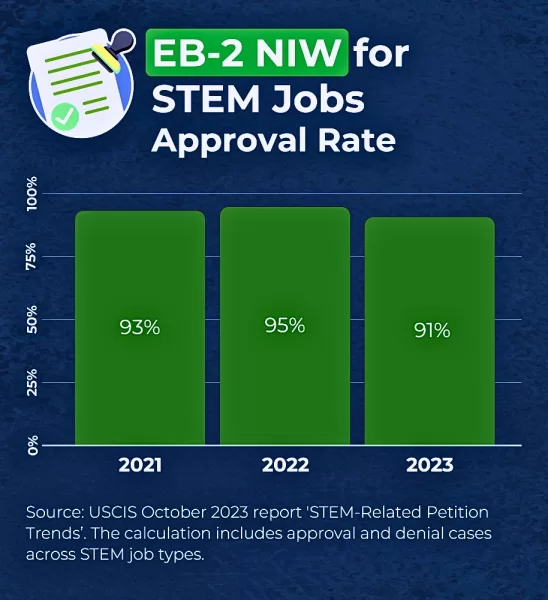
Let’s examine how approval rates differ between STEM and non-STEM job categories within the EB-2 NIW visa framework. The data reveals some interesting patterns. In 2021, STEM occupations such as software engineers, biomedical researchers, and data scientists achieved a high approval rate of 93%, indicating a positive outlook. This momentum carried into 2022, with the approval rate climbing further to 95%.
However, a slight decline was noted in 2023, when the approval rate for STEM jobs fell to 91%. This shift prompts a deeper look into the factors influencing the approval rates and the overall landscape of visa approvals for these essential roles.
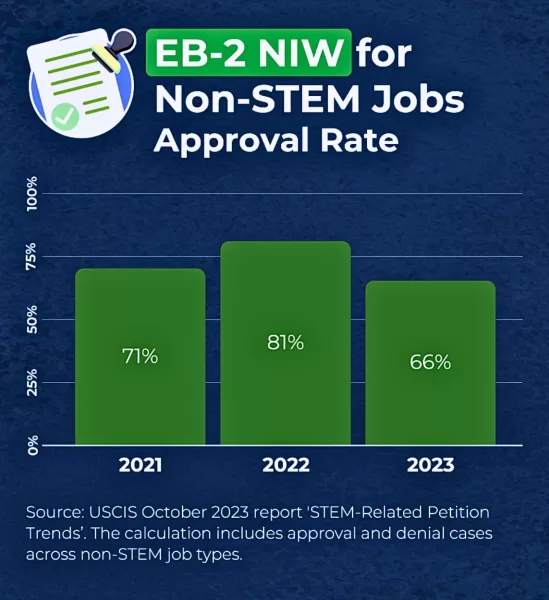
Turning our attention to non-STEM job categories within the EB-2 NIW visa category, we observe a unique pattern of fluctuations. Starting at 71% in 2021, there was a notable increase to 81% in 2022, suggesting an encouraging trend. Yet, in a surprising turn, 2023 saw a significant decrease in approval rates, dropping to just 66%. This sharp decline raises questions and calls for a thorough investigation into the dynamics affecting the approval rates for non-STEM occupations.
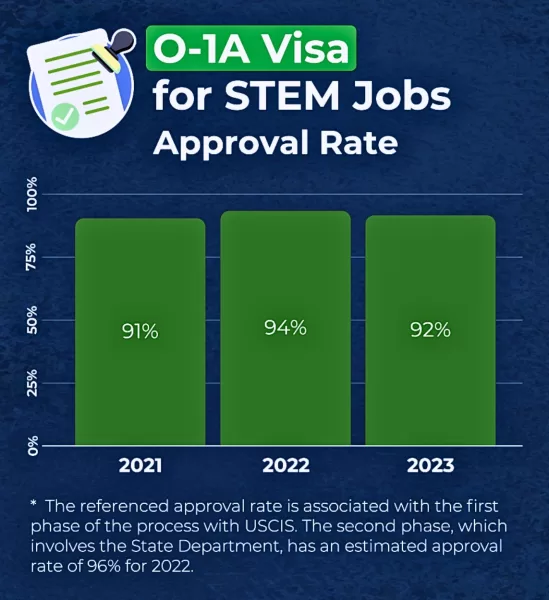
To understand the approval dynamics of the O-1A Visa, it’s important to recognize that it involves a two-step process, with the initial phase managed by the United States Citizenship and Immigration Services (USCIS). Our focus here is on this initial phase, where the approval rates provide insightful indicators.
According to the “STEM-Related Petition Trends” report, the data paints an impressive picture. In 2021, the O-1A Visa saw a high approval rate of 91%, with 7,320 approvals granted. The following year, this figure rose even higher to 94%, resulting in 9,120 approvals. Although there was a slight decrease in 2023, the approval rate remained robust at 92%, and the number of approvals increased to 9,490.
This sustained high level of approvals highlights the robustness of the O-1A Visa category, making it a compelling option for individuals possessing extraordinary skills and accomplishments in their fields.
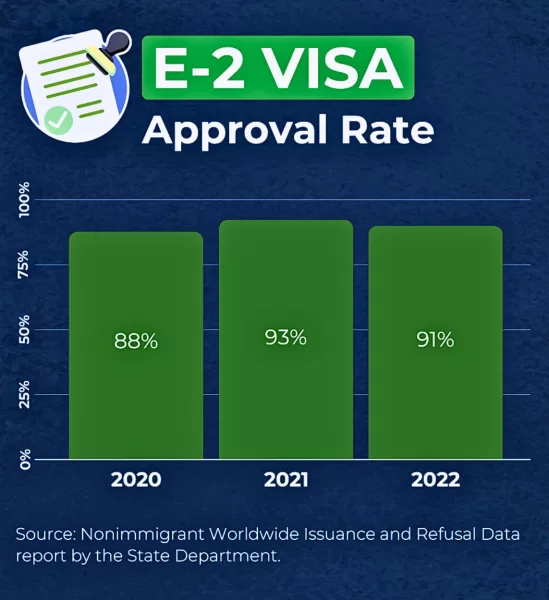
In 2022, the E-2 Visa maintained a strong approval rate of 91%, with 45,878 out of 50,701 applications receiving approval and 4,823 being denied. This represents a slight decrease from 2021’s peak approval rate of 93%, where 33,129 out of 35,812 applications were approved and 2,683 were rejected.
Going back to 2020, the approval rate was 88%, with 23,493 approvals out of 26,759 applications, and 3,266 rejections. These statistics not only illustrate the numerical changes over the years but also provide a detailed analysis of the evolving patterns and complexities that define the landscape of E-2 Visa applications.
As we wrap up our exploration of U.S. visa approvals, “Immigration Experts” is proud to serve as your trusted resource for precise and timely information. In this article, we’ve shared exclusive insights into the recent approval rates for critical visa categories—O-1, EB-2 NIW, and E-2 visas. These insights offer a thorough understanding of the current trends and statistics that are essential for making informed decisions in your visa journey.