Business Phone
051 8439995, 042 35911332
051 8439995, 042 35911332
Mon-Sat: 10.00-18.00

In January 2022, the U.S. Citizenship and Immigration Services (USCIS) revised its policy guidelines. The update clarifies the requirements for professionals in the science, technology, engineering, and mathematics (STEM) fields who are seeking to qualify for certain U.S. immigration benefits. These include the National Interest Waiver (NIW) under the employment-based second preference immigrant visa category (EB2) and the O-1A visa for individuals with extraordinary abilities.
This information sheet focuses on the latest trends and statistics in these visa categories for Fiscal Year (FY) 2022 and FY 2023, comparing the years before the policy was updated. Notably, there has been an increase in the number of EB-2 visa applications and the use of the National Interest Waiver from FY 2022 to FY 2023.
The updated policy guidance from the U.S. Citizenship and Immigration Services (USCIS) provides clearer instructions for certain foreign nationals who possess an advanced degree or exceptional ability. These individuals can now apply for the EB-2 employment-based immigrant visa on their own using Form I-140. Specifically, those applying for a National Interest Waiver (NIW) are allowed to bypass the usual requirements of having a job offer and obtaining a labor certification from the Department of Labor (DOL). This exemption is granted when it is determined that issuing a waiver serves the national interest of the United States.
The revised guidelines also explain how professionals in the fields of science, technology, engineering, and mathematics (STEM), as well as entrepreneurs, can prove they meet the criteria for this NIW. An important aspect of the application process, highlighted in the new policy, is the value of recommendation letters from governmental or semi-governmental organizations.
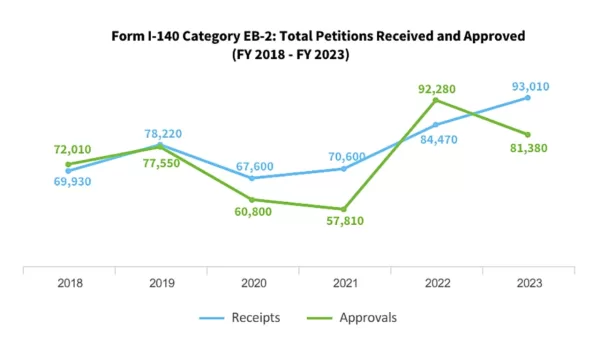
Following the change in policy guidance, there was a notable increase in the number of EB-2 visa applications. Specifically, the total number of Form I-140 filings, including both those requiring waivers and those without, rose by 20 percent from 70,600 in Fiscal Year (FY) 2021 to 84,470 in FY 2022. This upward trend continued into the next fiscal year, with an additional 10 percent increase in receipts from FY 2022 to FY 2023.
Approval numbers also saw significant changes. There was a 60 percent jump in approvals, from 57,810 in FY 2021 to 92,280 in FY 2022. However, approvals saw a decrease of about 12 percent the following year, dropping to 81,380 in FY 2023. Despite these fluctuations, the approval rate for these applications remained high, consistently staying at or above 90 percent from FY 2018 through FY 2023.
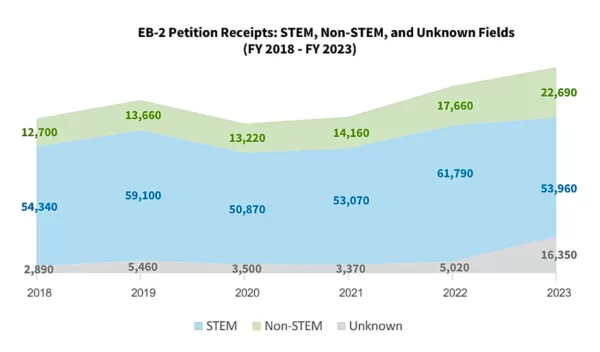
In the Fiscal Year (FY) 2023, there was a noticeable decrease in the total number of filings for STEM-related job categories, which dropped by almost 13 percent, from 61,790 in FY 2022 down to 53,960. In contrast, receipts for non-STEM job categories experienced a significant increase, rising by 28 percent during the same period.
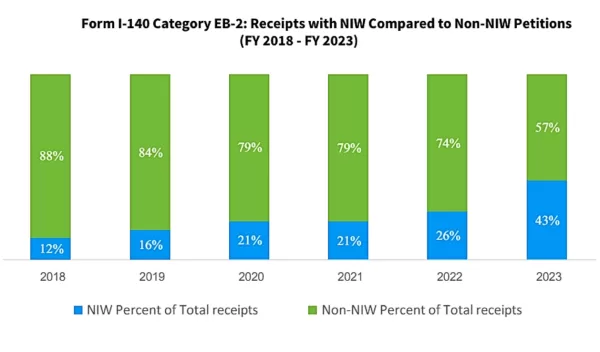
There has been a growing trend among EB-2 petitioners in seeking a National Interest Waiver (NIW). While petitions without NIWs still constituted the majority, the proportion of I-140 filings requesting NIWs has been on the rise. From the Fiscal Year (FY) 2021 to FY 2022, the percentage of receipts with NIWs increased from 21 percent to 26 percent. This growth accelerated in the following fiscal year, jumping from 26 percent in FY 2022 to 43 percent in FY 2023.
If you have advanced skills or exceptional talent, you might qualify for a U.S. residency through the EB2 NIW visa. Click here for details.
In terms of actual numbers, the increase in NIW petitions is striking. The count of petitions with NIWs nearly doubled, climbing from 21,990 in FY 2022 to 39,810 in FY 2023. Concurrently, the number of petitions filed without NIWs saw a decrease, moving from 62,490 to 53,200. This shift indicates a significant interest and reliance on the NIW route among EB-2 applicants.
| Fiscal Year | Receipts (Non-NIW) | Receipts (NIW) | Total Receipts | Completions (Non-NIW) | Completions (NIW) | Total Completions | Approvals (Non-NIW) | Approvals (NIW) | Total Approvals | Approval Rate |
| 2018 | 61,610 | 8,320 | 69,930 | 65,640 | 8,880 | 74,510 | 63,950 | 8,070 | 72,010 | 97% |
| 2019 | 65,710 | 12,510 | 78,220 | 72,270 | 7,390 | 79,660 | 70,940 | 6,610 | 77,550 | 97% |
| 2020 | 53,280 | 14,310 | 67,590 | 52,770 | 10,520 | 63,290 | 51,880 | 8,920 | 60,800 | 96% |
| 2021 | 55,990 | 14,610 | 70,600 | 48,760 | 11,210 | 59,970 | 48,170 | 9,650 | 57,820 | 96% |
| 2022 | 62,490 | 21,990 | 84,480 | 74,380 | 21,230 | 95,610 | 73,180 | 19,090 | 92,270 | 97% |
| 2023 | 53,200 | 39,810 | 93,010 | 50,230 | 39,840 | 90,070 | 49,630 | 31,750 | 81,380 | 90% |
Key Insights:
| Fiscal Year | Receipts (Non-NIW) | Receipts (NIW) | Total Receipts | Approvals (Non-NIW) | Approvals (NIW) | Total Approvals | Denials (Non-NIW) | Denials (NIW) | Total Denials |
| 2018 | 47,840 | 6,500 | 54,340 | 50,540 | 7,080 | 57,620 | 840 | 320 | 1,160 |
| 2019 | 49,850 | 9,260 | 59,100 | 54,360 | 5,600 | 59,960 | 670 | 320 | 990 |
| 2020 | 40,690 | 10,180 | 50,870 | 39,290 | 7,410 | 46,700 | 440 | 700 | 1,140 |
| 2021 | 43,640 | 9,440 | 53,070 | 37,950 | 7,670 | 45,620 | 360 | 610 | 970 |
| 2022 | 48,250 | 13,550 | 61,790 | 56,390 | 13,840 | 70,230 | 480 | 750 | 1,230 |
| 2023 | 33,010 | 20,950 | 53,960 | 35,910 | 21,240 | 57,150 | 280 | 2,120 | 2,400 |
Key Observations:
This data provides useful insights into the dynamics of the EB-2 visa category for STEM professionals, reflecting changes in approval rates and the growing appeal of the NIW among this group.
| Fiscal Year | Receipts (Non-NIW) | Receipts (NIW) | Total Receipts | Approvals (Non-NIW) | Approvals (NIW) | Total Approvals | Denials (Non-NIW) | Denials (NIW) | Total Denials |
| 2018 | 11,320 | 1,380 | 12,700 | 11,240 | 820 | 12,060 | 210 | 250 | 450 |
| 2019 | 11,120 | 2,540 | 13,660 | 12,440 | 790 | 13,230 | 160 | 230 | 390 |
| 2020 | 10,270 | 2,950 | 13,220 | 9,630 | 1,260 | 10,890 | 120 | 570 | 690 |
| 2021 | 10,820 | 3,340 | 14,160 | 9,450 | 1,650 | 11,100 | 100 | 690 | 790 |
| 2022 | 11,690 | 5,970 | 17,660 | 13,930 | 3,560 | 17,490 | 140 | 820 | 960 |
| 2023 | 10,880 | 11,810 | 22,690 | 11,390 | 7,510 | 18,900 | 110 | 3,920 | 4,030 |
Key Observations:
This data highlights the evolving landscape of EB-2 visa applications for non-STEM job types, particularly the changing dynamics in the approval and denial rates, and the increased preference for the National Interest Waiver.
Top of Form
| Fiscal Year | Receipts (Non-NIW) | Receipts (NIW) | Total Receipts | Approvals (Non-NIW) | Approvals (NIW) | Total Approvals | Denials (Non-NIW) | Denials (NIW) | Total Denials |
| 2018 | 2,450 | 440 | 2,890 | 2,170 | 170 | 2,340 | 540 | 220 | 760 |
| 2019 | 4,740 | 720 | 5,460 | 4,140 | 220 | 4,360 | 480 | 220 | 700 |
| 2020 | 2,320 | 1,190 | 3,510 | 2,960 | 250 | 3,210 | 320 | 320 | 640 |
| 2021 | 1,530 | 1,830 | 3,360 | 770 | 330 | 1,100 | 130 | 270 | 400 |
| 2022 | 2,550 | 2,470 | 5,020 | 2,860 | 1,690 | 4,550 | 220 | 430 | 650 |
| 2023 | 9,310 | 7,040 | 16,350 | 2,320 | 3,000 | 5,320 | 140 | 2,010 | 2,150 |
Key Observations:
This data provides insights into the evolving and complex nature of EB-2 visa applications involving unknown job types, highlighting trends that could influence policy adjustments and application strategies.
Source: USCIS