Business Phone
051 8439995, 042 35911332

051 8439995, 042 35911332
Mon-Sat: 10.00-18.00
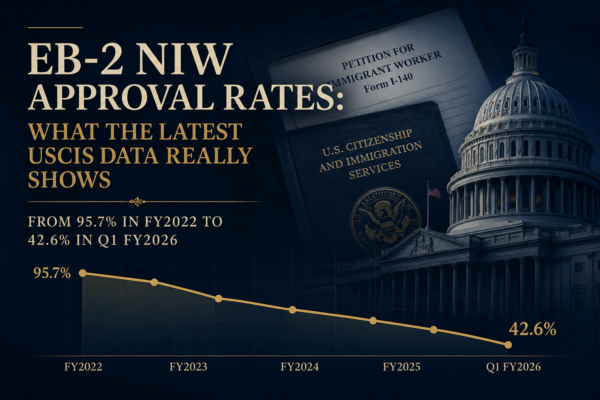
Approval rates have fallen a long way from their 2022 peak. Here’s what the quarter-by-quarter and year-by-year numbers actually say — and what still separates an approval from a denial.
Updated 09 Jul 2026Source USCIS Immigration and Citizenship Data
42.6%
Approval rate, Q1 FY2026
35.7%
Prior quarter low, Q4 FY2025
95.7%
Peak rate, FY2022
If you’re weighing whether to file an EB-2 National Interest Waiver (NIW) petition in 2026, you’ve probably seen the headlines about falling approval rates and wondered if it’s still worth pursuing. Approval rates have dropped significantly since their 2022 peak — but a well-built case still has a real shot.
Key takeaways
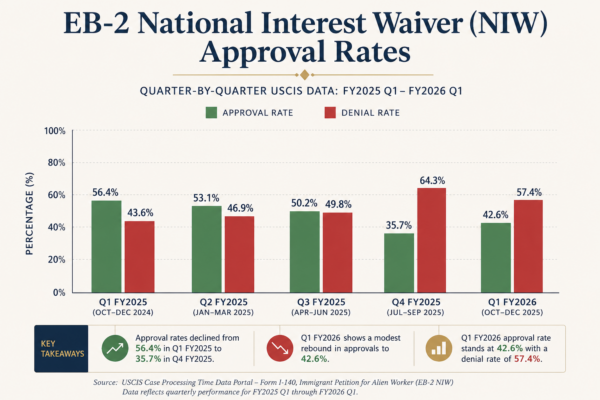
The most recent USCIS data covers the first quarter of Fiscal Year 2026 (October–December 2025). In that quarter, the EB-2 NIW approval rate came in at 42.6% — an improvement over the previous quarter’s low, but still far below the near-universal approvals seen just a few years ago. USCIS adjudicated 5,586 petitions in the quarter, approving 2,380 and denying 3,206 — the second consecutive quarter in which more petitions were denied than approved.
| Quarter | Approval Rate | Denial Rate | Petitions Adjudicated | Approved | Denied | Rate Visual |
|---|---|---|---|---|---|---|
| FY2025 Full Year | ~55.2% | 44.8% | 35,395 | 19,532 | 15,863 | |
| FY2025 Q1 | ~62.8% | 37.2% | 7,473 | 4,683 | 2,790 | |
| FY2025 Q2 | ~67.3% | 32.7% | 9,797 | 6,591 | 3,206 | |
| FY2025 Q3 | ~54.0% | 46.0% | 9,801 | 5,290 | 4,511 | |
| FY2025 Q4 | ~35.7% | 64.3% | 8,324 | 2,968 | 5,356 | |
| FY2026 Q1 | ~42.6% | 57.4% | 5,586 | 2,380 | 3,206 |
Source: USCIS Immigration and Citizenship Data. Green = approved share, red = denied share — bar widths match the stated percentages exactly.
To understand today’s numbers, it helps to look back at 2022, when the EB-2 NIW approval rate sat at roughly 95.7%. That spike wasn’t the new normal — it was the direct result of a 2022 executive action that led USCIS to broaden its interpretation of “national interest.” Advanced-degree graduates (especially in STEM), along with entrepreneurs, suddenly found it much easier to qualify.
That broader interpretation triggered a wave of new applications, including a large share of weak or poorly documented petitions. Because approval rates reflect every case adjudicated — strong and weak alike — the flood of lower-quality filings has steadily dragged the overall numbers down since then. By 2023, USCIS had tightened its adjudication standards and rates slid to around 62%. In 2024, the agency began applying the Dhanasar standard more rigorously, demanding measurable impact, concrete evidence, and a clearly defined benefit to the United States.
The Dhanasar standard itself dates back to 2016, stemming from a case in which an applicant successfully appealed a denied NIW petition. USCIS replaced the older, stricter test with a three-prong framework that now governs every NIW case:
01
Substantial merit and national importance
The proposed work must have measurable impact — not just personal or local value.
02
Well-positioned to advance the work
The applicant must show a track record and the ability to actually deliver on the proposal.
03
Waiving the job offer requirement benefits the U.S.
The national interest in the work must outweigh the protections labor certification gives U.S. workers.
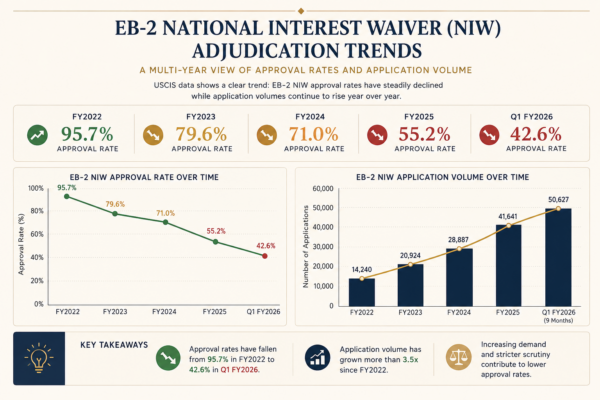
Zooming out from quarterly swings to full fiscal years shows just how far approval rates have fallen since the 2022 peak.
| Fiscal Year | Applications Received | Approved | Denied | Approval Rate | Denial Rate | Rate Visual |
|---|---|---|---|---|---|---|
| FY2022 | 21,973 | 10,316 | 468 | 95.7% | 4.3% | |
| FY2023 | 39,803 | 31,889 | 8,172 | 79.6% | 20.4% | |
| FY2024 | 63,549 | 27,526 | 11,256 | 71% | 29% | |
| FY2025 | 66,276 | 19,532 | 15,863 | 55.2% | 44.8% | |
| FY2026 (Q1 only) | 13,829 | 2,380 | 3,206 | ~42.6% | 57.4% |
The trend line is clear: as applications climbed from roughly 22,000 in FY2022 to over 66,000 in FY2025, approval rates fell in nearly the opposite direction — from 95.7% down to 55.2%, and now further to around 42.6% in the first quarter of FY2026.
Not necessarily. The published approval rate is a blended average across every applicant — including many who filed prematurely or without adequate evidence. It isn’t a prediction for any individual case.
If you’re preparing to file, the data suggests a few concrete steps matter more than ever.
Beyond the approval rate itself, timing carries its own weight. Filing now locks in your priority date, which matters increasingly given growing visa retrogression — particularly for applicants born in backlogged countries like India and China, who can face years-long waits even after approval. A denied petition doesn’t preserve your priority date either, so refiling means starting over at the back of the line.
What’s the current approval rate?
For Q1 FY2026 (October–December 2025), USCIS approved 42.6% of adjudicated EB-2 NIW petitions — up from 35.7% the prior quarter, but well below the 95.7% seen in 2022. This number shifts quarter to quarter and should be read as a snapshot rather than a forecast.Is the approval rate the same as my personal odds?
No. The published rate blends every petition reviewed, including weak or incomplete filings. A well-documented case built around the Dhanasar standard is judged on its own merits, not against the average.Why do petitions typically get denied?
The most common reasons are failing to demonstrate national (rather than local or personal) importance, weak evidence of being well-positioned to advance the work, generic recommendation letters that don’t engage with the Dhanasar prongs, and over-reliance on degrees or titles instead of measurable impact.What does a Request for Evidence (RFE) mean?
An RFE simply means an officer wants clarification or additional proof on a specific point — it’s not a denial, and a strong response can still lead to approval.Can I refile after a denial?
Yes, there’s no limit on refiling. But a new petition should directly address the gaps USCIS identified, and it does not preserve your original priority date — a new filing starts your wait over.Do certain fields have better odds?
Any field can qualify if the proposal ties clearly to national interest. STEM, medicine, and engineering applicants often find it easier to assemble supporting evidence, but strong cases have succeeded across many disciplines.Does country of origin affect approval chances?
It doesn’t change how USCIS adjudicates the petition itself, but it significantly affects the wait after approval — applicants from backlogged countries like India and China can face years-long delays, reinforcing the value of filing sooner.
